

The Bitcoin at 10 months low as it lost 56% since November 2021 when started the decline from $68,960 landing today at a low of $29,742. However, BTCUSD decline was expected but the geopolitical conflict in Eastern Europe pressured the Bitcoin to the lowest price in ten months.
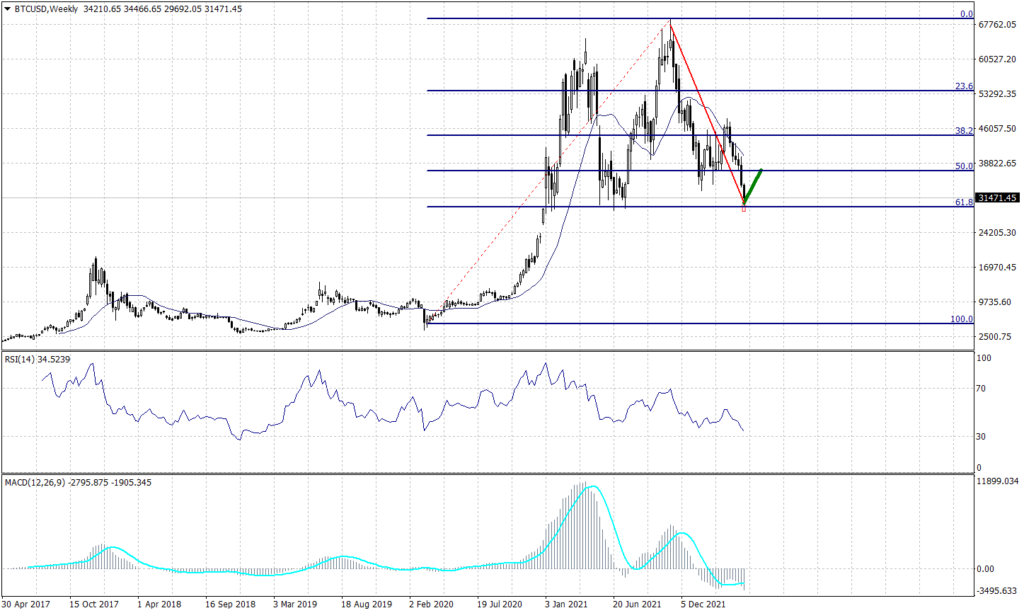
When looking at the long-term chart (weekly chart) it appears that the current levels are the strongest support for the Bitcoin since it broke above it in January 2021. However, the support level around $31,200 is a critical level of which if the price broke below, there will not be proper support before the $10,000.
The technical indicators in the long term show a negative outlook targeting $26,000, but it is worth mentioning again that there is no proper long-term support above the $10,000. On the other hand, the visual reading for the weekly chart shows a possibility of a rebound from the current support towards $37,200 near the Fibonacci 50 level.
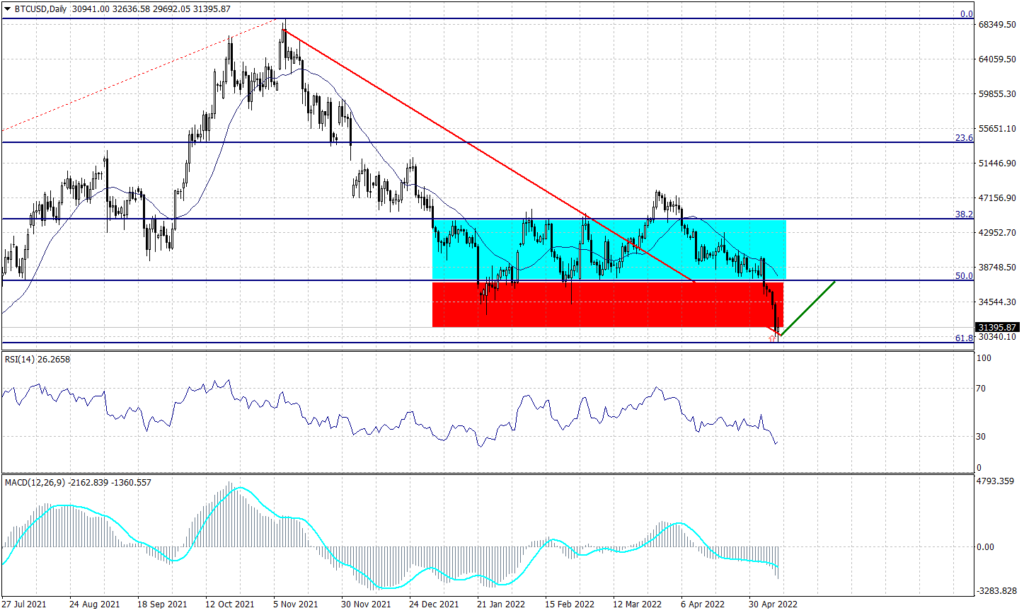
In the medium time frame, the BTCUSD shows a volatile movement inside a four-month horizontal channel between $37,240 and $44,700. The price has broken the channel downwards on the 5th of May 2022 to reach its 10-month low.
Technical indicators signal a further decline without a clear target. Meanwhile, Fibonacci retracement signals a possibility of a rebound towards $37,200 from $29,500. On the other side, if prices fell below 31,400, they will most likely continue the decline to $26,000.
Gold prices continue to break new highs as fear in the markets grow and demand…
U.S. Stocks recover in early trading following yesterday’s sharp declines Stock futures rose in early…
Gold has soared to a fresh high over the impact of the trade war between…
EUR/USD is climbing again after bouncing off 1.1270 over the 30-SMA, confirming it as support.…
China warns of retaliation against countries cooperating with U.S. trade measures that affect Chinese interests,…
Gold is less than $15 from the $3,400 level Gold continues to break new levels…
This website uses cookies.


