

U.S. real gross domestic product (GDP) increased at an annual rate of 2.9% in the fourth quarter of 2022, according to the “advance” estimate released by the Bureau of Economic Analysis. In the third quarter, real GDP increased by 3.2%. Current‑dollar GDP increased 6.5% at an annual rate, or $408.6 billion, in the fourth quarter to $26.13 trillion. In the third quarter, GDP increased by 7.7%, or $475.4 billion.
ECB president Christine Lagarde said, “In less than half a year, we have raised the ECB interest rates by 250 basis points, the fastest increase in our history.” Additionally, she confirmed that ECB interest rates will still have to rise significantly at a steady pace to reach levels that are sufficiently restrictive and stay at those levels for as long as necessary.
Despite the decline in GDP growth from 3.2% to 2.9% in Q4 2022, markets looked on the positive side as the numbers were higher than the expected 2.1%. The dollar index rose 0.12% during the morning session as investors expect more monetary policy tightening than previously expected.
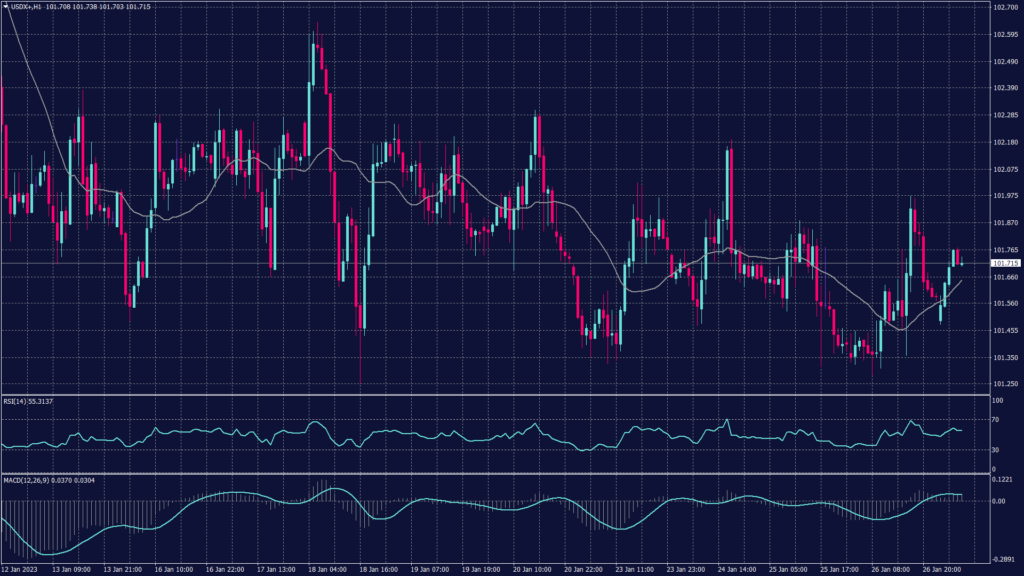
On the hourly chart, the dollar index was relieved from the selling pressure, but it is still in the horizontal range between 101.40 and 101.70. However, the daily chart shows a continuation of the downtrend as moving averages confirm resistance at 101.90 and 101.70. Meanwhile, RSI and MACD show neutral readings.
| SUPPORT | RESISTANCE |
| 101.40 | 101.90 |
| 101.25 | 102.00 |
| 101.00 | 102.10 |
The common currency lost 0.11% against the greenback to $1.0877, despite the positive notes from ECB president Christine Lagarde.
Lagarde confirmed further policy tightening to reach sufficiently restrictive levels and stay at those levels for as long as necessary. Markets ignored the positive hawkish tone and focused more on the data from the U.S. economy for more information about the Fed’s policy next week.
Technically, the fiber pair remains on the accelerating side on both hourly and daily charts. Meanwhile, the pair has built its support above 1.0870 and 1.0900 which depleted the selling pressure. Technical indicators remain on the rise and signal a high probability of further gains.
| SUPPORT | RESISTANCE |
| 1.0840 | 1.0990 |
| 1.0810 | 1.1050 |
| 1.0780 | 1.1110 |
Gold prices moved lower this morning below $1,930 to trade at $1,924 per ounce. Metal markets declined before the release of the PCE, the Fed’s preferred inflation gauge. The focus now is on the core Personal Consumption Expenditures price index reading for December, which is expected to have retreated further from the prior month. But the reading is still expected to remain well above the Fed’s annual target of 2%.
Spot gold steadied at $1,929.82 an ounce, while gold futures inched lower to $1,929.80 an ounce. The two instruments sank 0.8% on Thursday and were set to gain about 0.2% this week.
Gold remains within the horizontal range between 1,920 and 1,940 on the daily chart, indicating neutral trend pressure. However, the hourly chart shows a higher probability of fluctuations between 1,930 and 1,940. The intraday fluctuations will open a chance for speculative gains.
| SUPPORT | RESISTANCE |
| 1,921 | 1,927 |
| 1,916 | 1,932 |
| 1,910 | 1,938 |
Oil prices moved a little higher and were set to end the week flat amid caution over an upcoming OPEC+ panel meeting. On the other hand, markets are looking for more cues on the U.S. economy from a reading on the Federal Reserve’s preferred inflation gauge.
Brent oil futures rose 0.2% to $87.69 a barrel, while West Texas Intermediate crude futures rose 0.3% to $81.22 a barrel. Both contracts rose sharply on Thursday following better-than-expected U.S. GDP data but were set to end the week largely unchanged.
Technically, crude oil is trading under bearish pressure that is accumulating above the $80 mark. The chart is expected to show further decline as the hourly chart shows slowing buying pressure. The technical indicators show divergence and a tendency for further decline.
| SUPPORT | RESISTANCE |
| 79.65 | 81.70 |
| 79.10 | 82.60 |
| 78.45 | 83.50 |
Key Takeaways U.S. Markets Close Lower with Growing Trade and Fed Tensions ECB Cuts Interest…
EURUSD: Potential Bearish Correction as RSI is in Overbought Territory Following a strong uptrend since…
Dear Valued Clients, To enhance your trading experience, we will be performing a historical data…
Oil prices went up on Thursday to regain some of the losses it has incurred…
Key Takeaways: All three major US indices close lower this week after volatile sessions Netflix…
About IA Pickleball Cup 2025 On March 8, 2025, STARTRADER participated as the Diamond Sponsor…
This website uses cookies.


