

The PPI reading is expected to herald a similar trend in the more closely watched consumer price index, which is set to be released next week. Rising interest rates were the biggest weight on gold prices this year, dragging the metal off annual highs as the opportunity cost of non-yielding assets rose. The direction of the Fed’s interest rate hikes in 2023 depends largely on inflation, which is still trending well above the central bank’s target range.
The dollar eased on Friday as worries over a slowdown in the United States mounted, with traders on guard ahead of a slew of central bank meetings next week, where the Federal Reserve takes the main stage.
Yields on U.S. Treasuries have also slumped, with the two-year yield, which typically reflects interest rate expectations, last at 4.3035%, away from its 15-year high of nearly 4.9% hit last month. A closely watched part of the U.S. Treasury yield curve, measuring the gap between yields on two- and 10-year Treasury notes was inverted at -83.7 bps.
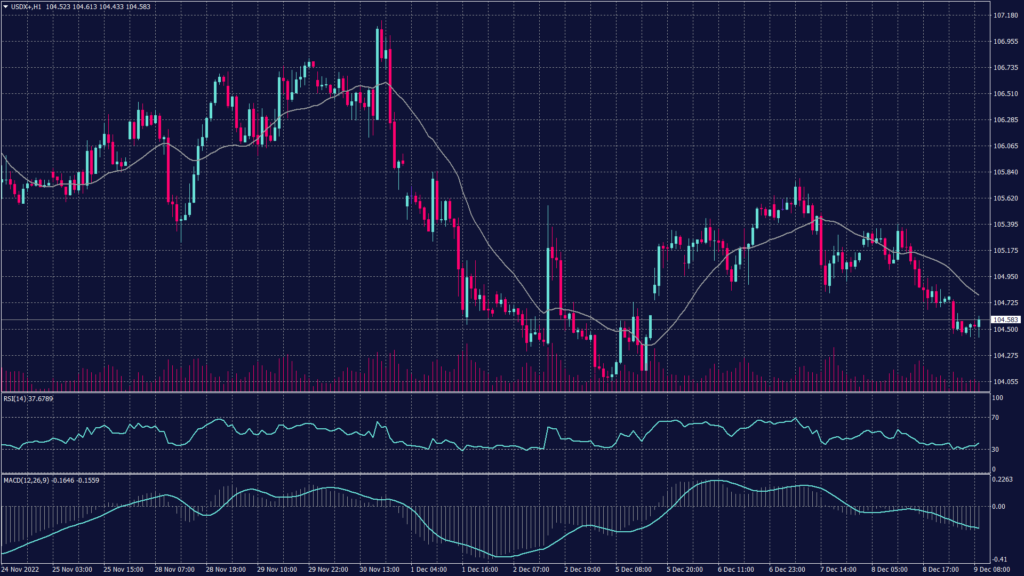
The U.S. dollar index fell 0.27% to 104.53, after slipping 0.3% overnight. On the daily chart, the overall trend remains negative and targets the support at 104.40. However, the technical indicators show fluctuations with a heavier selling pressure build-up.
| SUPPORT | RESISTANCE |
| 104.10 | 104.70 |
| 103.80 | 104.90 |
| 103.50 | 105.20 |
Against the greenback, the euro rose nearly 0.5% overnight and edged toward a six-month peak hit at the start of the week. It was last 0.23% higher at $1.0579 and is on track for a third straight week of gains. The European Central Bank (ECB) releases its monetary policy decisions next week, with markets keenly watching for guidance on 2023’s outlook.
| SUPPORT | RESISTANCE |
| 1.0550 | 1.0590 |
| 1.0500 | 1.0800 |
| 1.0400 | 1.1000 |
Gold prices slightly moved this morning as investors slowed down ahead of key U.S. data due later in the day. Bullion prices are expected to close the week lower as fears of a recession invited some safe haven plays back into the yellow metal. Recent weakness in the dollar also benefited gold prices.
Spot gold hovered around $1,789.43 an ounce, while gold futures steadied at $1,801.25 an ounce.
The 4 hours and the daily chart show a high probability of continuing the uptrend despite the readings of the technical indicators. However, RSI and MACD show a probability of a slight drop to $1,765 per ounce.
| SUPPORT | RESISTANCE |
| 1,775 | 1,795 |
| 1,765 | 1,800 |
| 1,750 | 1,810 |
Oil prices bounced on Friday as the closure of a major Canada-to-U.S. crude pipeline disrupted supplies, but both benchmarks were headed for a weekly loss on worries over slowing global demand growth. Brent crude futures were at $76.70 a barrel gaining 0.72%, while West Texas Intermediate crude rose 0.73% to $71.98 a barrel.
| SUPPORT | RESISTANCE |
| 71.70 | 73.50 |
| 70.50 | 73.90 |
| 70.00 | 75.20 |
Dear Valued Client, Please be advised that the following CFD instruments will be automatically rolled…
Dear Valued Clients, Please be advised that the following instruments' trading hours and market session…
EURUSD Nears Major 1.1500 level EURUSD nears the crucial level of 1.1500 as pressure on…
Tech stocks drive US indices higher Monday's session closed higher, led by tech stocks after…
The ball is now in the U.S. court after Beijing fired back raising tariffs on…
The gold rush began after a failed breakdown below the 2960 support level, which triggered…
This website uses cookies.


